Integrating a new charting library in the latest version of DotKernel (1.6.0) we offer a new experience with this new intuitive and interactive charts.
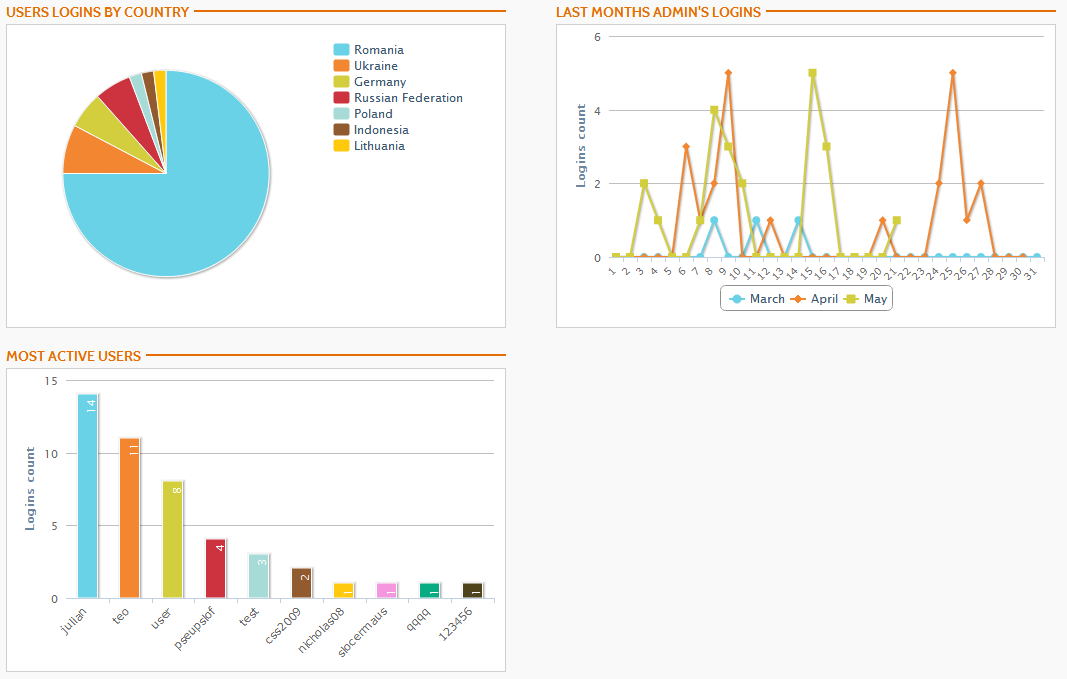
Also in admin we made some samples using highcharts. These samples includes an pie chart (with a small custom feature), an column chart and the last one is an line chart.
>chart = new Highcharts.Chart({
        chart: {
            renderTo: elementId,
            type: 'line',
            plotBackgroundColor: null,
            plotBorderWidth: 0,
        },
        credits: {
            enabled: false
        },
        title: {
            text: ''
        },
        colors: colors,
        tooltip: {
            formatter: function() {
                    return '' + this.series.name + ' ' + this.x + '
' + 'Total logins: ' + this.y;
            }
        },
        yAxis: {
            title: {
                text: 'Logins count'
            },
            min: 0
        },
        xAxis: {
            categories: ,
            labels: {
                rotation: -45,
                align: 'right',
                style: {
                    font: 'normal 10px Verdana, sans-serif'
                }
            }
        },
        series: timeActivity
    });